Finance Analytics provides insights into key metrics and gives finance reps the data they need. The interactive reports compare invoices to target, display KPIs per client, forecast sales, and highlight top suppliers based on POs created in commonsku.
Finance Analytics will help answer questions like:
- What is our monthly revenue?
- Have we reached our sales target?
- Who are our most profitable clients?
- Who are our top suppliers?
This help article explains how to use Finance Analytics to track sales projection, monitor invoices to target, and push reps to work with your team's preferred suppliers.
Users need permission to "View Finance Menu" to use Finance Analytics.
This feature is not available to teams subscribed to commonsku's Essentials plan. The Advanced plan or higher is required in order to use this tool.
On this page:
How to sort Finance Analytics by client or client status
Key terms
Client statuses: Customizable fields that help organize your customer portfolio for more detailed reporting.
Margin/Profit: Sales revenue minus the cost of goods sold, not including tax. Margins can be displayed as a whole number or a percentage.
Pre-sale: A preliminary sales form, like a presentation or estimate, or any sales-related activity before creating an actual sales order, like a new sales opportunity.
Revenue: Total sales income, not including tax.
Value: An estimate, sales order, or invoice's subtotal.
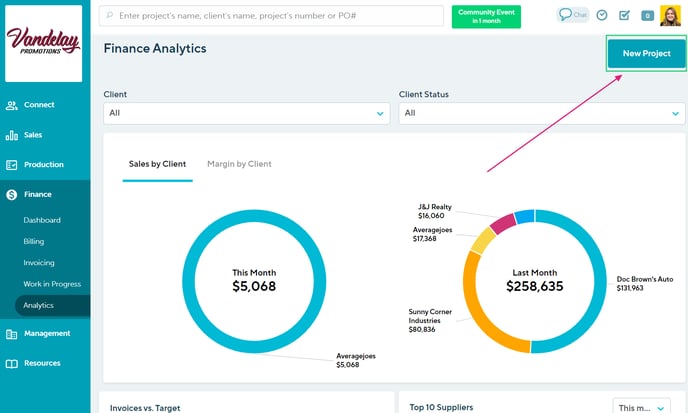
How to create a new project from your Finance Analytics
- Click New Project in the top right corner.
- Select a pre-existing client from the drop-down list, or click + New Client at the bottom of the drop-down to add a new client to commonsku
- If you are adding a new client (optional):
- Type the client's name
- Select their industry from the drop-down menu
- Click Create Client
- If you are adding a new client (optional):
- Enter a Project Name
- Select an Event Type from the drop-down
- Select your Starting Stage
- Click Continue
How to sort Finance Analytics by client or client status
Finance Analytics can display metrics for a specific client or clients with a certain status.
Finance reps can alternate the Finance Analytics' filters as needed to track trends across different clients.
Sales by Client
Sales by Client measures sales from this month and last month by revenue earned per client. Isolating sales per client reveals the highest-selling accounts as a percentage of total sales and shows how they drive company earnings.
Finance reps can use Sales by Client to identify their team's top accounts and assist the management team with reporting.
How to use Sales by Client:
- Hover over the doughnut chart's slices (yum) to view the dollar value of sales per client.
- Click into a client-specific section to open a list of invoices
- Filter the invoices by selecting different column titles (for example, click on the "Stage" column to filter the results by stage)
- Click on the hyperlinked project name or number to be redirected to the project
- Select any project to open a slide-out menu with more details and action items, like completed or pending action items (tasks). From the slide-out menu, you can:
- Update the form's status, the project's in-hands date, budget, and assigned reps
- Create and manage any related tasks
- Click the Actions button to view either the project or the client's page.
- Select the "Other" slice to view clients that make up the lower portion of total sales. Click the zoom-out icon to return to the standard view.
Margin by Client
Margin by Client measures margins from this month and last month by profit earned per client. Isolating margin per client reveals the most profitable accounts as a percentage of the total margin.
Finance reps can use Margin by Client to identify their team's highest margin accounts and assist the management team with comparative reporting.
How to use Margin by Client:
- Hover over the doughnut chart's slices (yum) to view profit per client.
- Click into a client-specific section to open a list of forms
- Filter the forms by selecting different column titles (for example, click on the "Stage" column to filter the results by stage)
- Click on the hyperlinked project name or number to be redirected to the project
- Select any project to open a slide-out menu with more details and action items, like completed or pending action items (tasks). From the slide-out menu, you can:
- Update the form's status, the project's in-hands date, budget, and assigned reps
- Create and manage any related tasks
- Click the Actions button to view either the project or the client's page.
- Select the "Other" slice to view clients that make up the lower margin sales. Click the zoom-out icon to return to the standard view.
Invoices vs. Target
Invoices vs. Target measures how monthly revenue compares to the sales teams' targets.
Reps can use Invoices vs. Target to track revenue and their team's progress towards their sales targets.
The Invoices vs. Target Reports' popup menu shows which invoices were created within a given month, including their invoice status, enabling users to catch any missed orders and keep track of invoices that need to be sent to the client, exported, or are pending payment.
How to use Invoices vs. Target:
- Hover over a month to see the value of invoices created within that month and compare sales to target.
- Click into a month to open a list of invoices within that month
- Filter the invoices by selecting different column titles (for example, click on the "Stage" column to filter the results by stage)
- Click on the hyperlinked project name or number to be redirected to the project
- Select any project to open a slide-out menu with more details and action items, like completed or pending action items (tasks). From the slide-out menu, you can:
- Update the form's status, the project's in-hands date, budget, and assigned reps
- Create and manage any related tasks
- Click the Actions button to view either the project or the client's page.
- Deselect the checkbox beside "Previous Year", "This Year" or "Target" to remove it from the graph and click the zoom-out icon to increase the value ranges.
Users with permission to "modify sales target" can set monthly sales goals through the Sales tab > Projects > Sales Forecast Report.
Top 10 Suppliers
The Top 10 Suppliers tile highlights the sales team's top suppliers of the month.
The Top 10 Suppliers tile helps finance reps with bill forecasting and makes it easy to keep their finger on the pulse on where sales reps are directing business.
How to use Top 10 Suppliers:
- Hover over the supplier to view the total value of purchase orders created this month
- Select the date filter in the top right corner to filter down by:
- This month
- This year
- Last year
The Top 10 Suppliers' date filter helps finance reps track their spending with top suppliers and ensure they get the best rate based on their spending.
Projection
The Projection tile provides a projection of revenue for the current month and the next two months, comparing potential sales to monthly targets.
Finance reps can use the Projection tile to forecast sales and view a revenue breakdown by each project's stage.
How to use the Projection tile:
- Hover over each month to view a breakdown of sales by form type (pre-sales vs. sales order vs. invoice) and compare how sales compare to the monthly target.
- Click on the bar graph for a list of projects that fall within each month.
- Filter the projects by selecting different column titles (click on the "Stage" column to filter the results by stage).
- Select any project to open a slide-out menu with more details and action items, like completed or pending action items (tasks). From the slide-out menu, you can:
- Update the form's status, the project's in-hands date, budget, and assigned reps
- Create and manage any related tasks
- Click the Actions button to view either the project or the client's page.
- Deselect the checkbox beside "Pre-sales," "Sales Orders," "Invoices," or "Target" to remove it from the graph and click the zoom-out icon to increase the projected revenue range.
Users with permission to "modify sales target" can set monthly sales goals through the Sales tab > Projects > Sales Forecast Report.
FAQ
Are the Finance Analytics reports based on booked margins or billed margins?
Analytics reports are based on each project's billed margin.