On this page:
Accessing the Sales Dashboard Reports
Accessing the Sales Dashboard Reports
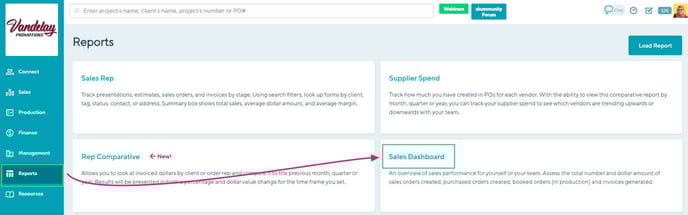
To access the Sales Dashboard Reports:
- Click into your Reports tab
- Select Sales Dashboard
Sales Dashboard
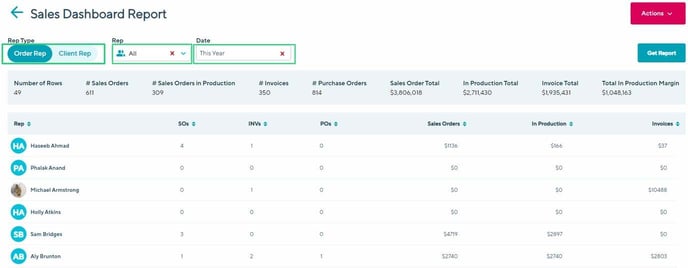
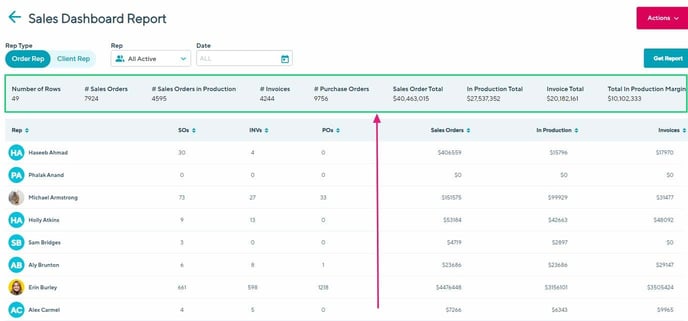
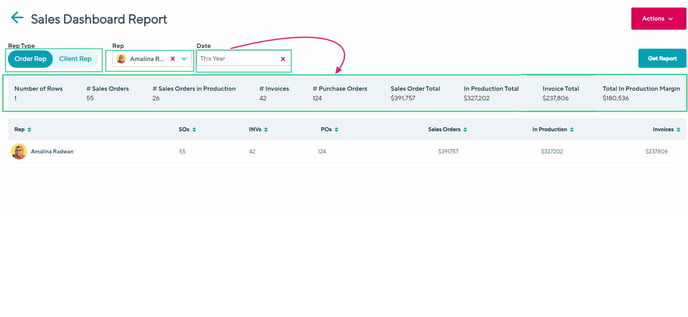
The Sales Dashboard tracks orders your team has created, booked and invoiced. It displays a sum of the sales orders, invoices, and purchase orders made within a given timeframe, as well as the dollar value of the newly created sales orders (Sales Orders), the orders that were moved into production (In Production), and the newly created invoices(Invoices).
[Back to top]
Filters
Each report contains the following filters:
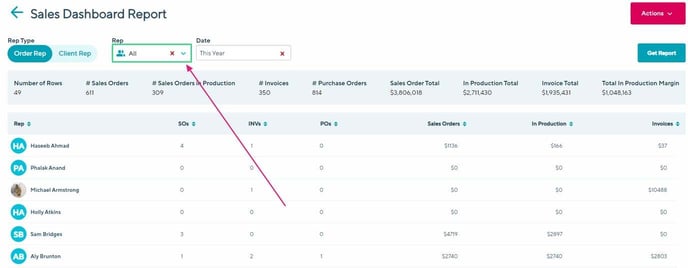
- Rep Type
- Rep Name
- Date
To select a report, click on the Rep type toggle and make your Rep Name and Date selection.
Include inactive reps
Select the rep status to "All" to include inactive client or order reps in your reporting.
How to pull a report
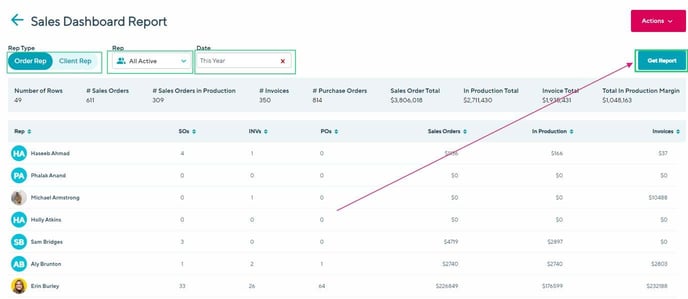
Once you have selected your report filters, click Get Report.
To reset all of your filters, select the Red X icon.
How to sort a report
Once you have pulled a report, click on a column title arrows up or down to sort that column by alphabetical or numerical order.
How to create a custom report
You can save specific Search filter selections and create your own custom Sales Rep reports. Your saved reports are only available under your login; they are not shared across your entire team.
Learn how to:
To create a custom report:
- Select your preferred filters on the Search tab
- Click Actions > Save Report
- In the "Save Report" pop-up, enter a report name
- Click Save
To delete a custom report:
- Click Actions > Load Report
- In the "Load Report" pop-up, select Report
- Click the
 icon next to the report you want to delete
 - In the "Are you sure you want to delete the saved report" pop-up: Click Delete
How to load a custom report
- Click Actions > Load Report
- In the "Load Report" pop-up, select Report
- Click Load
Totals
The Sales Dashboard Report's totals box above displays the:- Number of rows (form)
- Number of sales orders
- Number of Sales orders in Production
- Number of invoices
- Number of purchase orders
- Sales order subtotal
- In production subtotal (sales order's with the stage In Production)
- Invoice subtotal
- Total in production margin (margin of order's orders with the stage In Production)
Managerial reports
Here are a few examples of the information you can get from your Sales Dashboard Reports:
Booked orders
To booked order report shows the orders your team has booked within a given timeframe.
To pull a booked orders report:
- In the Sales Dashboard Report, select the toggle Rep Type: Order Rep or Client Rep, Rep Name (optional), Date: This year (optional)
- Click Get Report
- Refer to the totals in the right-hand corner to see the total value of booked orders (In Production Total) and the margin of the sales orders that were moved into production (Total in Production Margin)
CSV exports
After you've pulled a report, click Export to export a CSV file of the report details.
CSV exports make it easy to organize large amounts of data.
The Sales Dashboard Report's CSV export contains the:
- Sales Rep
- Sum of client accounts created
- Sum of presentations created
- Sum of estimates created
- Sum of sales orders created
- Sum of invoices created
- Value of the sales orders created
- Value of the sales orders moved into production
- Value of the invoices created
- Sum of purchase orders created